

How do you draw a cumulative frequency graph? (Part 1)
Given this set of data...
For cumulative frequency graphs, remember to plot your points at the TOP of each class boundary, DO NOT use midpoints.
See Part 2 of this card for the actual graph
| Time, t | Frequency | Cumulative Frequency |
| 0< t ≤10 | 22 | 22 |
| 10< t ≤15 | 32 | 54 |
| 15< t ≤20 | 26 | 80 |
| 20< t ≤25 | 15 | 95 |
| 25< t ≤30 | 5 | 100 |
For cumulative frequency graphs, remember to plot your points at the TOP of each class boundary, DO NOT use midpoints.
See Part 2 of this card for the actual graph
How do you draw a cumulative frequency graph? (Part 2)
Here is the actual graph
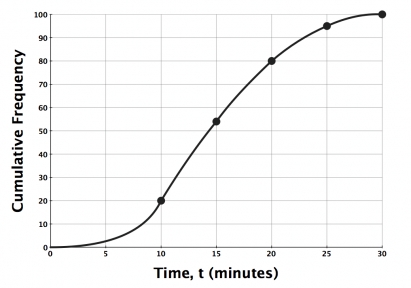
Notice it starts with a cumulative frequency of zero from the top class boundary of the class below.
Notice it starts with a cumulative frequency of zero from the top class boundary of the class below.
Why are moving averages useful?
They show a general trend and/or remove seasonal variations.
What is a frequency diagram?
If you are asked to draw simply a frequency diagram, then you may draw either a frequency polygon or a frequency histogram (equal-width bars with no gaps).
You must read the question very carefully. Make sure you're doing the right type of graph.
You must read the question very carefully. Make sure you're doing the right type of graph.
How do I calculate the estimated mean of grouped data?
Given this set of data for the test marks of a class of students, find an estimate for the mean test score of the class.
To actually calculate the mean...
Total of (frequency * midpoint) column ÷ Total Frequency
765 ÷ 23 = 33.3 (1 d.p.)
Always check your answer makes sense
| Mark (m) | Number of students | Midpoint | Freq x midpoint |
| 0<m≤25 | 4 | 12.5 | 4x12.5=50 |
| 25<m≤35 | 5 | 30 | 5x30=150 |
| 35<m≤40 | 8 | 37.5 | 8x37.5=300 |
| 40<m≤45 | 5 | 42.5 | 5x42.5=212.5 |
| 45<m≤60 | 1 | 52.5 | 1x52.5=52.5 |
| Totals: | 23 | 765 |
To actually calculate the mean...
Total of (frequency * midpoint) column ÷ Total Frequency
765 ÷ 23 = 33.3 (1 d.p.)
Always check your answer makes sense
How do I calculate mean from a frequency table?
A school recorded the number of days that Year 9 pupils were absent last week.
Calculate the mean number of days absent
To find the mean...
Sum of (number of days x number of pupils) ÷ Number of pupils
100÷200=0.5
Notice that no midpoints are needed as this is not grouped data.
Calculate the mean number of days absent
| Number of days | Number of pupils | No of days x No of pupils |
| 0 | 144 | 0x144=0 |
| 1 | 27 | 1x27=27 |
| 2 | 18 | 2x18=36 |
| 3 | 8 | 3x8=24 |
| 4 | 2 | 4x2=8 |
| 5 | 1 | 5x1=5 |
| Total: | 200 | 100 |
To find the mean...
Sum of (number of days x number of pupils) ÷ Number of pupils
100÷200=0.5
Notice that no midpoints are needed as this is not grouped data.
For what type of data are histograms suitable?
Histograms can only be used for continuous data.
Frequency density histograms are useful where class widths are not equal.
Frequency density histograms are useful where class widths are not equal.
How can probabilities be given?
Probabilities can be given as:
* Fractions
* Decimals
* Percentages
NEVER give a probability as anything else (including ratio).
* Fractions
* Decimals
* Percentages
NEVER give a probability as anything else (including ratio).
Key features of different graph types
Histograms:
No gaps between bars.
Frequency Histograms:
Equal bar widths.
Frequency as y-axis
Frequency Density Histograms:
Different bar widths.
Frequency Density as y-axis
Cumulative Frequency graphs:
Points plotted at top of class-boundaries.
Smooth curve through points.
Frequency Polygons:
Frequencies plotted at class mid-points.
Points joined with straight-lines.
Why is a 7-point moving average appropriate for the daily sales of a shop?
If you get a question, for example, asking why a 7-point moving average is appropriate, it's probably something to do with there being seven days in a week.
A 4-point moving average is often used for seasons (Autumn, Winter, Spring, Summer) because there are 4 of them.
Make sure you're answering the question though.
Why do we use a moving average?
is a different question to
Why is a 4-point moving average appropriate to this data?
For the second question, you must be specific as to why a four point moving average is used.

Kartensatzinfo:
Autor: mrfoxton
Oberthema: Mathematics
Thema: Handling Data
Veröffentlicht: 18.10.2009
Schlagwörter Karten:
Alle Karten (14)
keine Schlagwörter
